class: center, middle, inverse, title-slide # gghdr: Graphing highest density regions <br> using grammar of graphics ### <br> Sayani Gupta <br> <i class='fab fa-github'></i> Sayani07 <i class='fab fa-twitter' style='color:#6CADDE'></i> SayaniGupta07 <br><font> <small><a href="https://sayanigupta-useR2020.netlify.com/" class="uri">https://sayanigupta-useR2020.netlify.com/</a></small> ### <font size = "7"> useR! 2020 --- class: top left # Graphing distribution summaries .left-column[ - several ways to summarize a distribution - R package ggdist for visualizing distributions and uncertainty ] .right-column[ <!-- --> ] --- class: top left # Different summarization expose different features .left-column[ - Boxplot not suitable for summarizing multi-modal distributions - often useful to display different summarization in unison ] .right-column[ <!-- --> ] --- background-image: url("images/hdr_paper.png") background-position: center background-size: contain --- # Highest Density Region (HDR) plots <font size = "3.5"> If `\(f(x)\)` is the density function of a random variable `\(X\)`, then the 100 `\((1 -\alpha)\)` HDR is the subset `\(R(f_\alpha)\)` of the sample space of `\(X\)` such that `\(R(f_\alpha) = \{x: f(x) \geq f_\alpha\}\)`, where `\(f_\alpha\)` is the largest constant such that `\(Pr(X \in R(f_\alpha)) \geq 1-\alpha)\)`. <img src="images/falpha.png" width="80%" /> --- # Graphing HDRs using R package hdrcde <i><font size = "4"> Data set: Waiting time between eruptions and the duration of the eruption for the Old Faithful geyser in Yellowstone National Park, Wyoming, USA. </font size = "4"></i> .pull-left[ ```r faithful %>% as_tibble ``` ``` ## # A tibble: 272 x 2 ## eruptions waiting ## <dbl> <dbl> ## 1 3.6 79 ## 2 1.8 54 ## 3 3.33 74 ## 4 2.28 62 ## 5 4.53 85 ## 6 2.88 55 ## 7 4.7 88 ## 8 3.6 85 ## 9 1.95 51 ## 10 4.35 85 ## # … with 262 more rows ``` ] .pull-right[ <!-- --> ] --- # Graphing HDRs using R package hdrcde <img src="images/allplots1png.png" width="90%" /> --- # Extending ggplot2 - HDR is a novel technique for summarizing distribution for which plotting is not implemented in ggplot2 - ggplot2 creates graphics based on The Grammar of Graphics - graphics are built step by step by adding new elements that allows for extensive flexibility and customization of plots - need to extend the functionality of ggplot2 --- class: top left # Package gghdr .pull-left[ - implement HDR plots in ggplot2 - key elements: *geom* and *stats* - inspired from R package [`hdrcde`](https://pkg.robjhyndman.com/hdrcde/) developed by [Rob Hyndman](https://robjhyndman.com/) ] .pull-right[ .animated.bounce[ <img src="images/gghdr_logo.png" height=280px> ] ] --- # HDR boxplots .pull-left[ ```r library(hdrcde) hdr.boxplot(faithful$eruptions) ``` <br> <!-- --> ] .pull-right[ ```r library(gghdr) library(ggplot2) ggplot(faithful, aes(y = eruptions)) + geom_hdr_boxplot() ``` 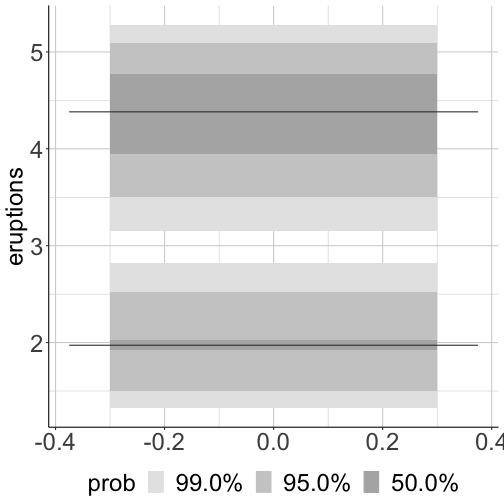<!-- --> ] --- # HDR rug plots and scatter plots .pull-left[ ```r faithful %>% ggplot(aes(x = waiting, y = eruptions)) + geom_hdr_rug(fill = "blue") + geom_point() ``` 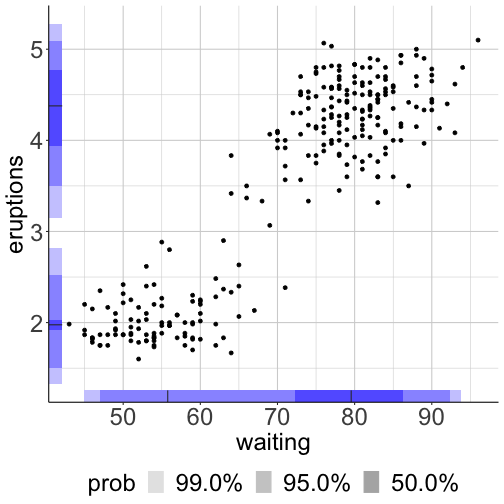<!-- --> ] .pull-right[ ```r faithful %>% ggplot(aes(x = waiting, y = eruptions)) + geom_point(aes(colour = hdr_bin(x = waiting,y = eruptions))) ``` 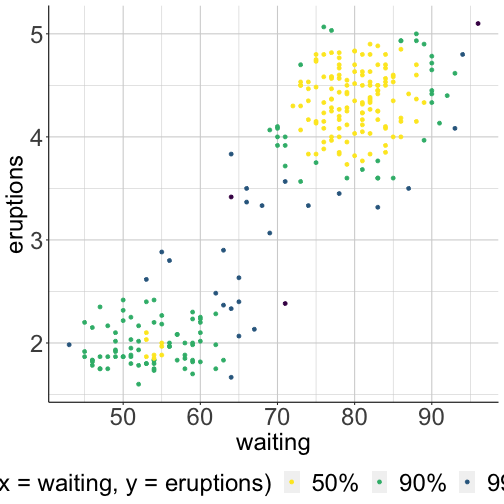<!-- --> ] --- class: top left # Keep combining - HDR box + jitter .pull-left[ ```r faithful %>% ggplot(aes(y = eruptions)) + *geom_hdr_boxplot(fill = c("blue")) + *geom_jitter(aes(x = 0)) ``` - jitter to supplement the insight drawn from the HDR boxplot ] .pull-right[ 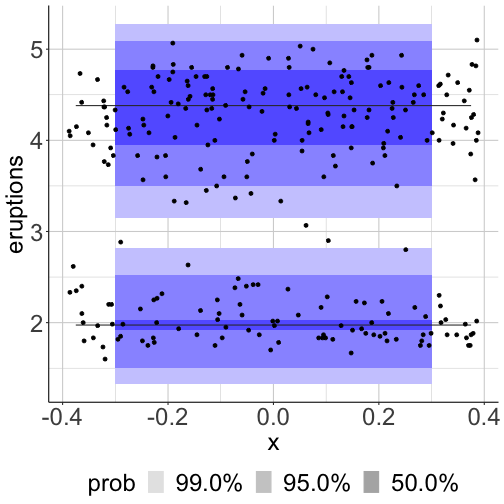<!-- --> ] --- class: top left # Keep combining - HDR scatter + HDR marginal .pull-left[ ```r faithful %>% ggplot(aes(x = waiting, y = eruptions)) + * geom_point(aes(colour = hdr_bin(x = waiting, y = eruptions)))+ * geom_hdr_rug() ``` - Both bivariate and marginal HDRs displayed at once - Bimodality in both marginal and bivariate distributions ] .pull-right[ <!-- --> ] --- # Authors <!-- --> --- class: middle top # More Information Package: https://github.com/ropenscilabs/gghdr Slides: https://sayanigupta-useR2020.netlify.com/ Materials: https://github.com/Sayani07/useR2020 Slides created with <i> Rmarkdown, knitr, xaringan, xaringanthemer</i>